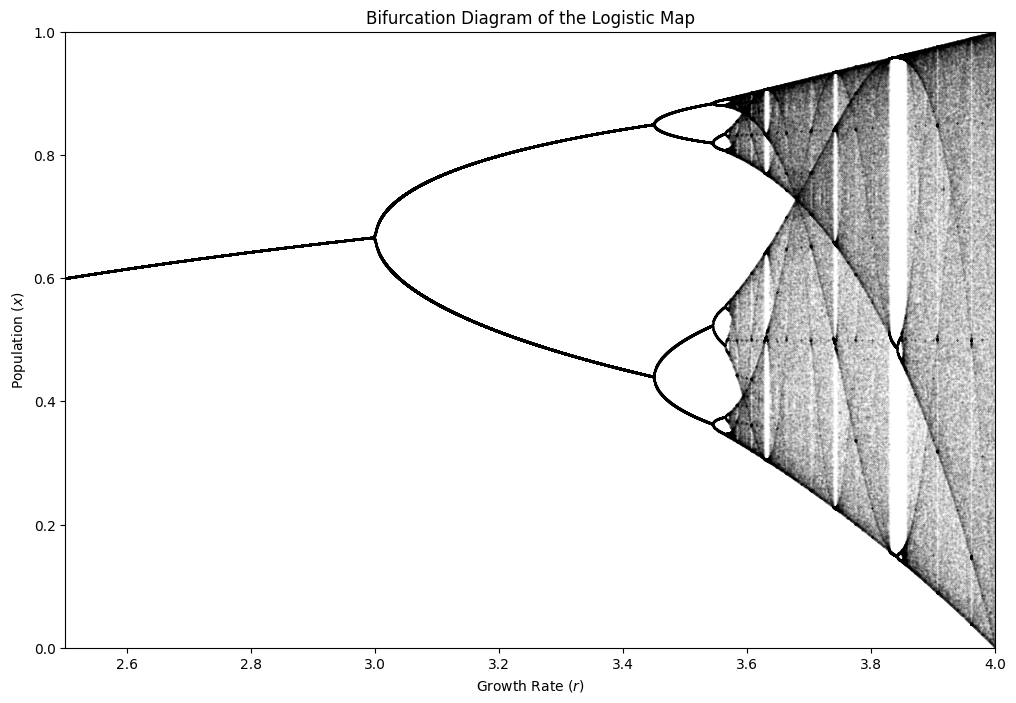
importnumpyasnpimportmatplotlib.pyplotasplt#paramsr_min,r_max=2.5,4.0n_r=10000n_transient=1000n_last=100r=np.linspace(r_min,r_max,n_r)x=0.5*np.ones(n_r)foriinrange(n_transient):x=r*x*(1-x)r_list=[]x_list=[]foriinrange(n_last):x=r*x*(1-x)r_list.append(r)x_list.append(x)r_plot=np.array(r_list).flatten()x_plot=np.array(x_list).flatten()plt.figure(figsize=(12,8))plt.scatter(r_plot,x_plot,s=0.1,c='black',alpha=0.1)plt.title('Bifurcation Diagram of the Logistic Map')plt.xlabel('Growth Rate ($r$)')plt.ylabel('Population ($x$)')plt.xlim(r_min,r_max)plt.ylim(0,1)plt.grid(False)plt.show()